Click to close the planning and operations loop
Read our blog to learn how MinePlan integrates to close the loop between planning and operations with a single click.
An integrated web-based solution that combines planned schedules and operational progress. Maximize your mine’s ROI by keeping planners, operations and management informed of plan deviations so they can pivot and minimize value lost.
An integrated solution that assembles planned schedules and operational progress in a web-based solution accessible to those who need it most.


In the mining industry, we spend significant amounts of time developing the optimal plan, to maximize the return on investment for our mine. The moment we diverge from this optimal plan, we lose value.
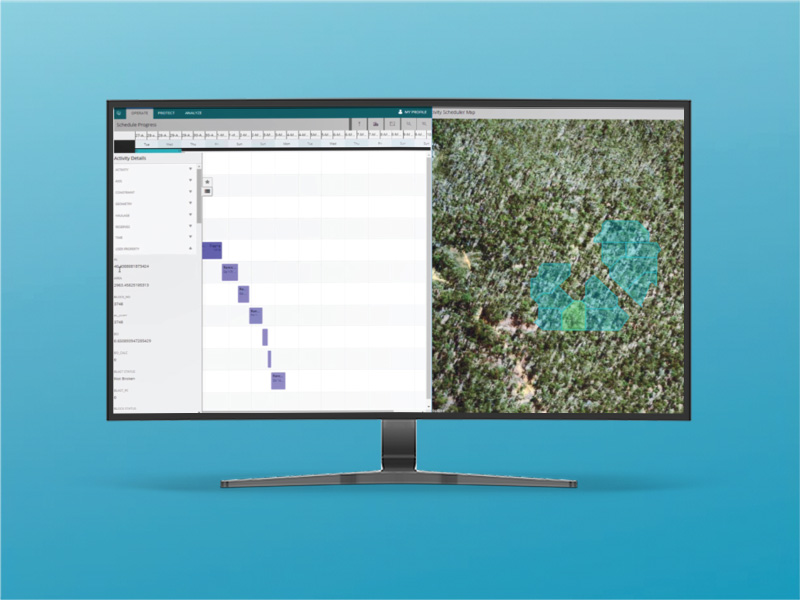
HxGN MinePlan Interval Control is an integrated web-based solution that brings together planned schedules and operational progress.
True to Hexagon’s autonomous connected ecosystems strategy, MinePlan Interval Control connects planning and operations processes and workflows with integrated technology. The solution lets you know if you’re compliant to plan and quickly informs you when you’re not. Planners, operational teams and management can quickly pivot and minimize value lost.
Production-value information is both easily accessible and visualized to empower proactive group decision-making. Visual style cues allow you to visualize how the schedule will realize the value in your commodity. Spatial plan visualization means you can communicate quickly and streamline processes used to distribute the plan.
Hexagon systems share definitions of equipment, mining blocks, etc. Add MineOperate OP Fleet Analytics to connect operational progress from MineOperate OP Pro for automated progress tracking. Planning engineers can pivot, update and re-issue the schedule in MinePlan Activity Scheduler.
Easy interaction using a web browser means you can visualize and report production-value information realized by the schedule, aiding group awareness and decision-making, as well as improving the process for reporting progress to management.
Hone the use of your data by setting color styling cut-offs for all properties. Each user can choose the appropriate color cues, allowing everyone to visualize how the schedule will realize the value in your commodity. Check the schedule against downstream requirements.
Visualize plans spatially using connected-map technology to communicate clearly. Identify physical constraints and collaborate on production decisions, such as equipment location. The same visual cues and colors are applied to the spatial visualization.
Read our blog to learn how MinePlan integrates to close the loop between planning and operations with a single click.
See how safety analytics and powerful data visualization reveal the story behind near-miss events and incident investigation. Risk hot spots and interactive heat maps help you respond to change risky behaviors.
In a video interview, Lac a Paul mine sector director, Raphael Gaudreault explains how his team is using MinePlan Activity Scheduler to manage a project, which features significant civil works.
Conuma Coal invested in a safety package to protect employees and equipment. It integrates systems for collision avoidance, fatigue monitoring and a web-based reporting and analytics enterprise platform.