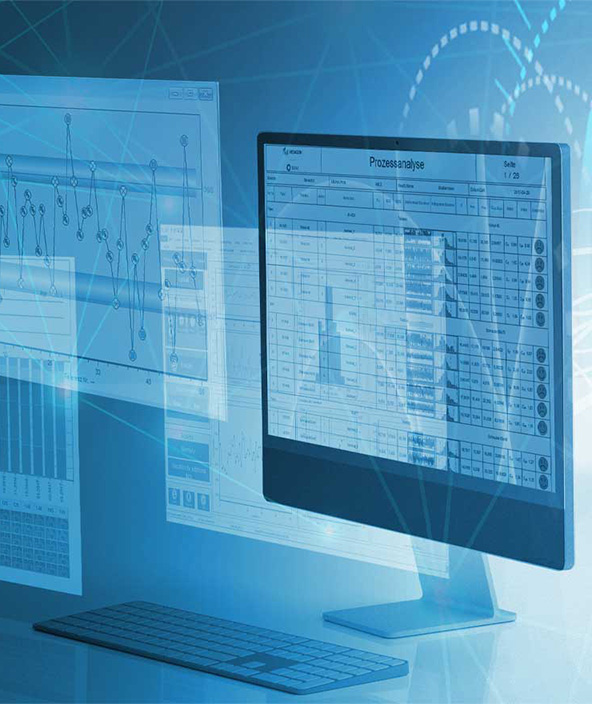
Q-DAS Statistical Process Control
Q‑DAS is the global standard for statistical quality assurance in industrial production, digitalising measurement data into a centralised quality data foundation where process knowledge is built and leveraged across the organization. Q‑DAS enables consistent, reliable analyses without requiring statistical expertise, making it accessible to any user.

Explore statistical process control (SPC) software
Explore the modules below to learn more about each product, its capabilities, and how it addresses your specific quality challenges.
Product enquiry
-
 Product
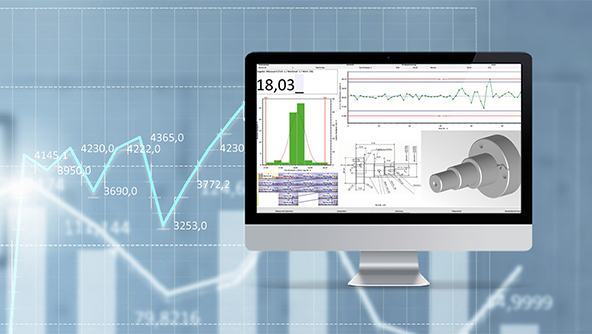
solara.MP builds trust in every measurement, ensuring repeatable and reliable inspection processes through VDA 5 and ISO 22514-7 compliant MSA to prevent quality issues.
-
×Human-Assisted autonomyMeasurement process capability analysis
-
-
 Product
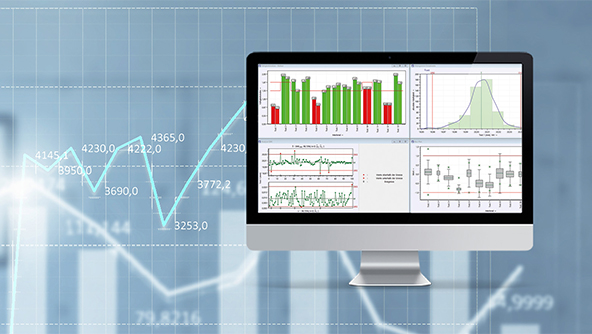
qs‑STAT delivers compliant machine acceptance and process capability, validating Cm/Cmk and Cp/Cpk to ISO 22514‑2, revealing root causes through reliable analyses.
-
×Human-Assisted autonomyProcess qualification analysis
-
-
 Product
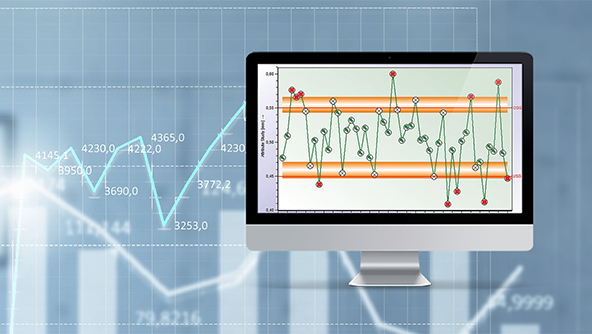
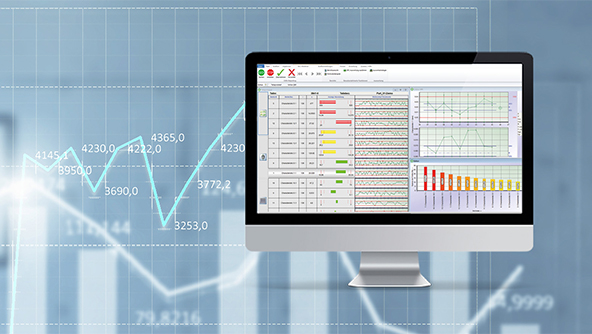
O‑QIS safeguards data quality at the source by assessing measurements in real time, ensuring ISO 22514‑aligned, DFQ‑based, gage‑independent for analysis in qs‑STAT.
-
×Human-Assisted autonomyData collection, real-time visualisation and alarming system for operators
-
-
 Product
Q-DAS procella digitalises manual measurements by capturing data from a wide range of manual gages, guiding operators with visual routines to reduce human error.
-
×Human-Assisted autonomyData collection, real-time visualisation and alarming system for operators
-
-
 Product
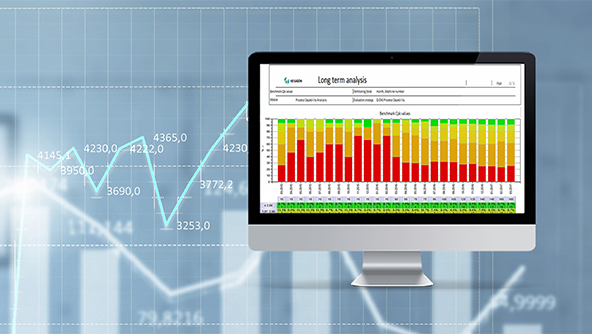
M QIS automates quality analysis across shifts and time periods, eliminating manual analysis, continuously monitoring incoming data, and detecting issues.
-
×Conditional autonomyAutomated reporting and data-aggregation job scheduler
-