Q-DAS PLV | Plant viewer
PLV gives the user a completely new view with fresh insights into quality data and quality aspects
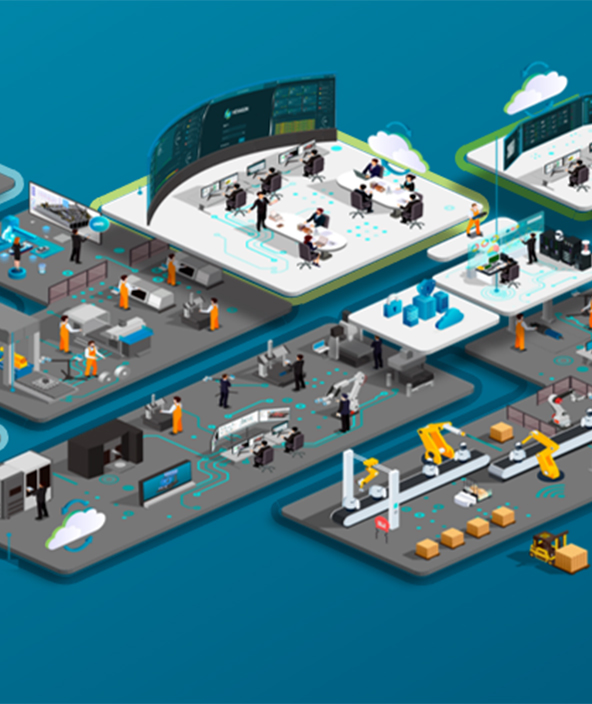
Monitor machines, lines, plants and entire companies from every place
Using PLV, all machines can monitor and immediately see the measurement result for the parts manufactured on these machines regardless of the actual location.
Ready to learn more?
View of the equipment
The focus here is on a clear structure that is developed starting with the production machine and building “upwards”. Using PLV, all machines can monitor and immediately see the measurement result for the parts manufactured on these machines regardless of the actual location. PLV’s goal is to give its user-ranging from line supervisors to managers-an overview of the information that is relevant to the user.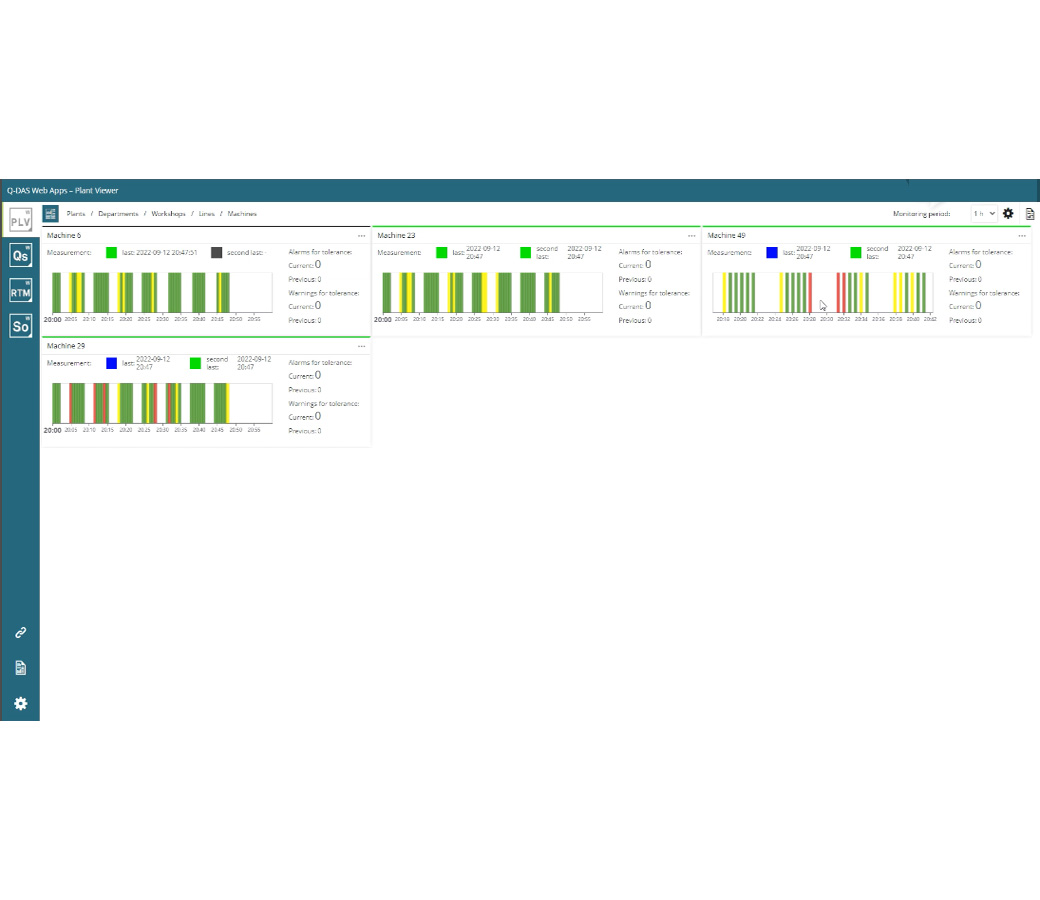
Product capabilities
Machine monitoring
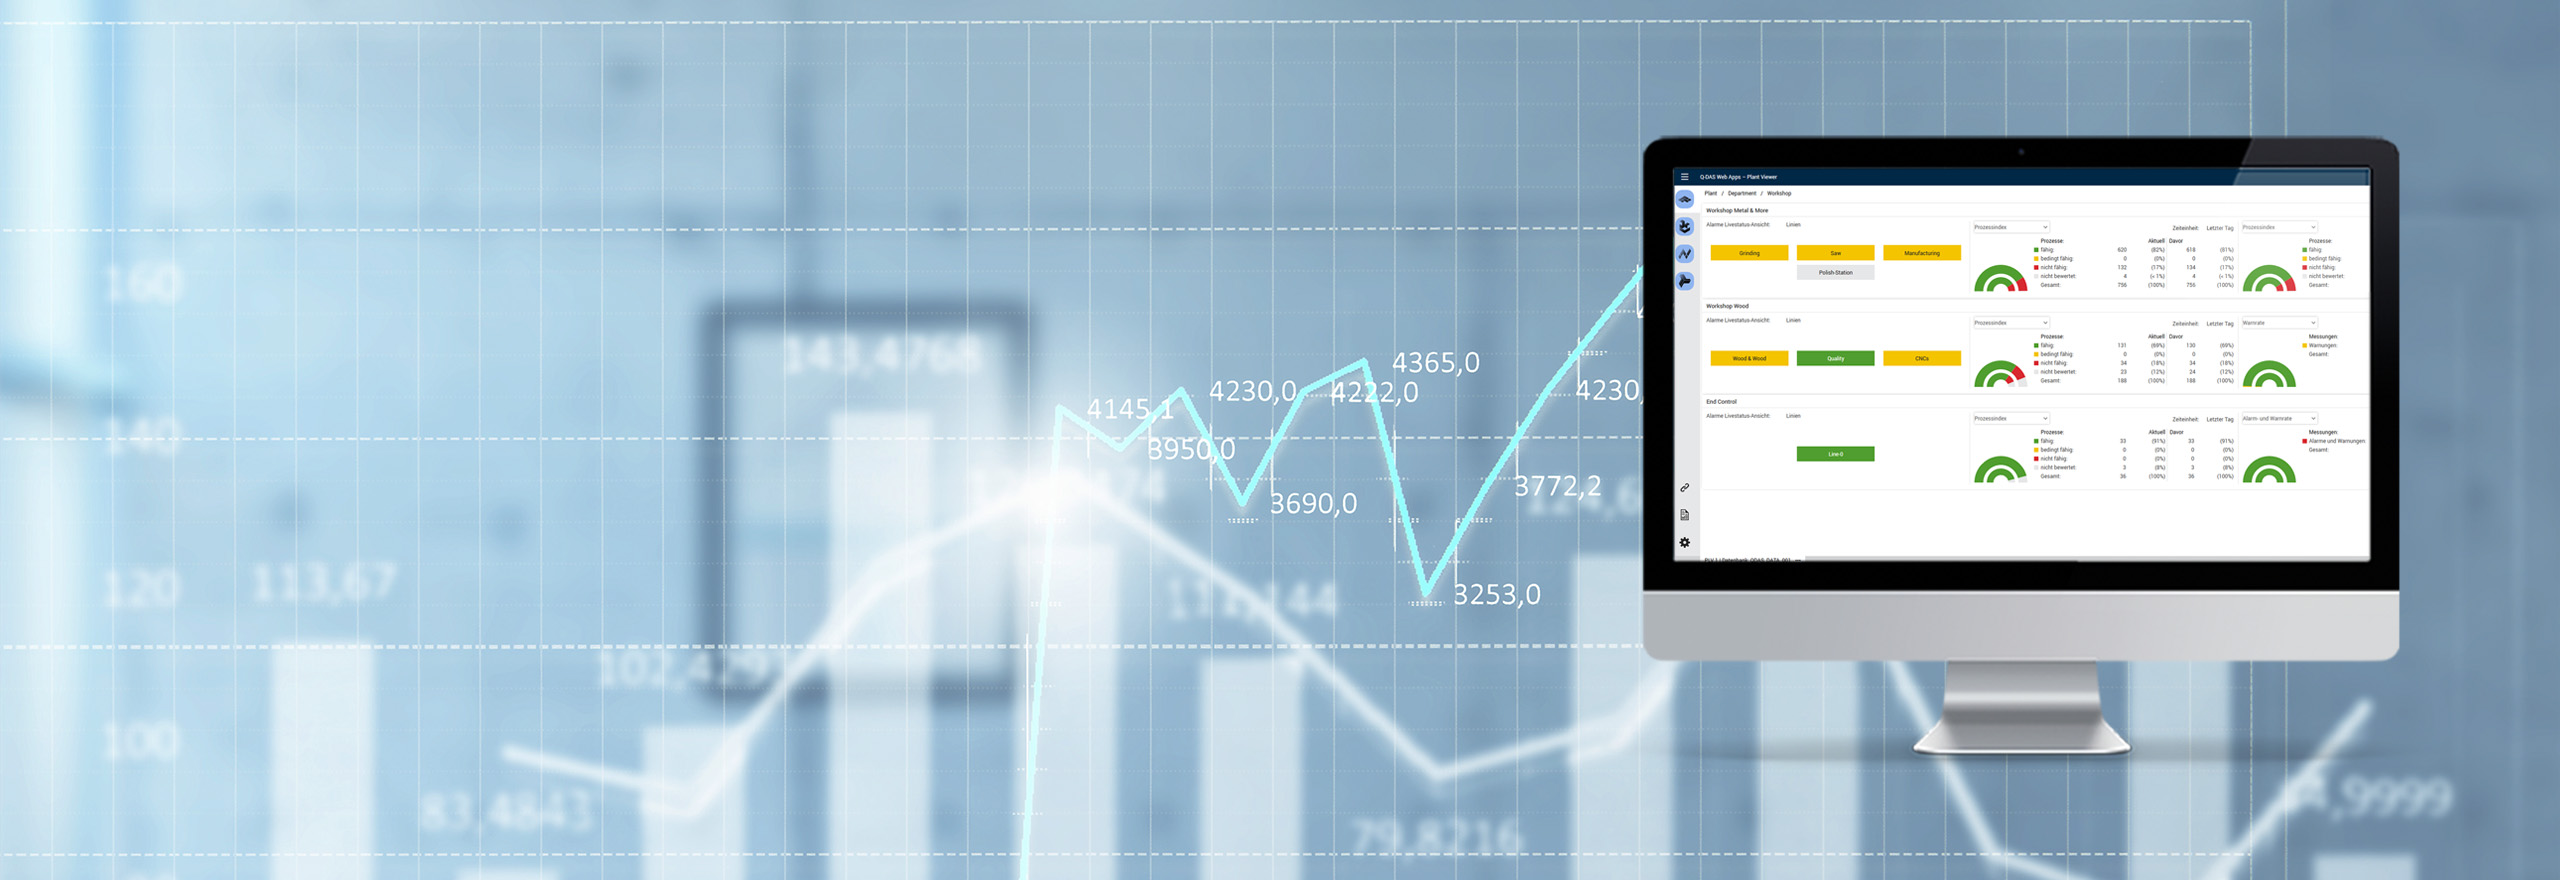
Clear view of the quality status of the production machines
PLV allows quality managers, production managers and line managers to select the machines they want to see for monitoring. PLV is designed in such a way to support a control station scenario providing the responsible person with an overview of the selected machinery. In this way, the user can select an unlimited number of machines, or just those that are of interest.
The deliberately simple graphical interface and its graphics make it easier for the user to register either an alarm or a limit value being breached. With the well-known “traffic-light” system as an indicator, the user can see the current situation at first glance and make an assessment.
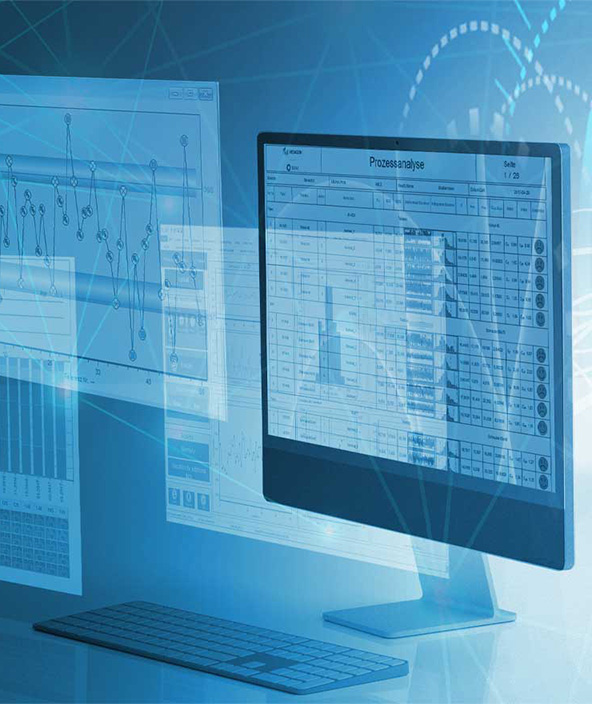
With the new Analysis & Reporting tool that has been integrated into PLV, users can now generate their own reports. Based on the aggregated data of PLV, reports can now be generated, saved as templates, or called up directly using a shortlink. The Analysis & Reporting Tool is directly connected to the new Explorer to manage and retrieve saved reports.
Guided wizards help you do the setup in a few clicks
Using the simple and highly intuitive wizard, you can create an initial dashboard in just a few clicks.
When developing PLV, as with all the other new web products, great importance has been attached to making the system setup as easy as possible for the user. Initial creation, modification or deletion of a machine never requires more than three clicks. The wizard guides the user and gives information about the options.
With the latest release, two detail pages have been added in order to access detailed information about individual measurements and / or machines even more quickly and easily.
Detail page for measurements: Users are now directly shown the information about the measurements in question. The page shows users the reasons for the alarm and provides further information on the overall context.
Detail pages for machines: Here, the user can clearly display the quality level of the parts manufactured on a particular machine. This enables targeted analysis of bad parts.
The Analysis & Reporting Tool is directly connected to the new Explorer to manage and retrieve saved reports.
Data can be further analysed and evaluated immediately via direct connection to other Q-DAS products
Using the “drop-off” functions, the user can further analyse the current data set of the monitored machine at any time in just one click.
The data set (e.g. the data for a product that was manufactured on a machine) can either be opened with Q-DAS | RTM or opened directly using Q-DAS qs-STAT. The respective application is automatically started or loaded with the corresponding data. If the detailed monitoring of a data set (e.g. the data for a part, monitoring based on the characteristics) is paramount, this can be done using Q-DAS | RTM Real-Time Monitoring.
It is possible to work with Q-DAS qs-STAT for conventional analysis of the data (e.g. to perform statistical analysis). Launching the application and loading the correct data set for the respective task is fully automatic (provided the respective product’s license is open-source and active).
Extensions:
-
Languages
-
Form Designer
-
3D CAD Viewer
-
Serial interfaces
-
Q-DM Datamanagement
-
SAP QM-STI interface