Q-DAS O-QIS
The SPC Software O-QIS records and evaluates measurement values from different measurement systems (e.g. CMM)
The tool for classical statistical process control (SPC)
O-QIS provides essential features fully supporting users in their quality assessment tasks.
Ready to learn more?
Real-time visualisation
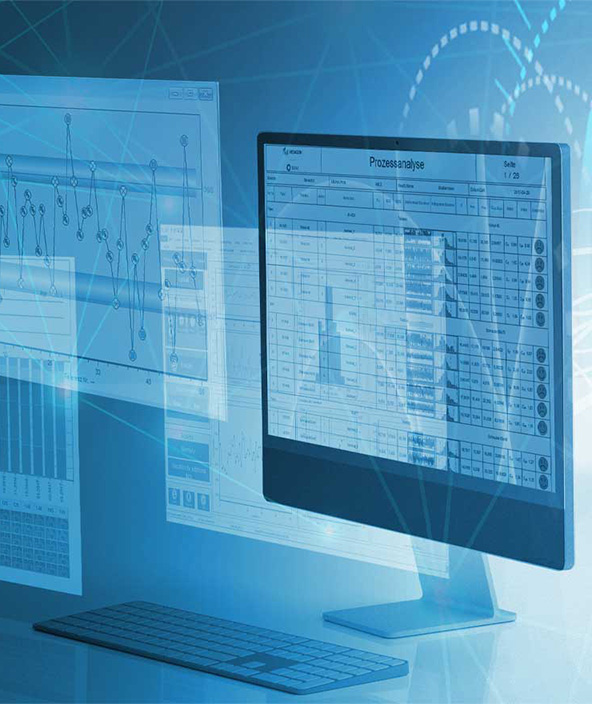
Q-DAS O-QIS is used to display and evaluate inspection and process data. There are several different ways of generating these data. For that reason, Q-DAS O-QIS has various modules to offer the right solution for the task at hand and is also available as a web-based product.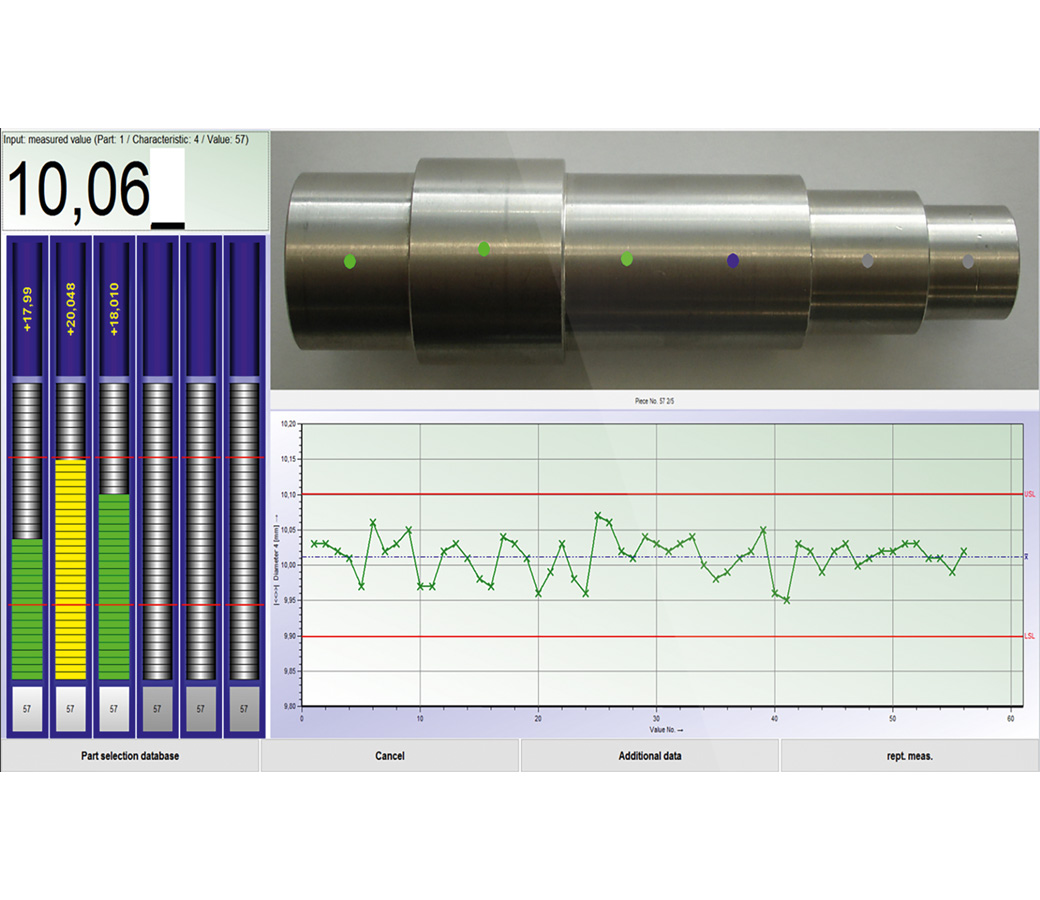
Product capabilities
SPC for process documentation
There are different ways to record measurement and test data and to transfer them to O-QIS. Besides manual input of data, the software is also able to transfer data directly from portable measuring equipment, multipoint measuring instruments, measuring devices and multiplexers via RS232 or USB interface. Appealing charts (e.g. quality control chart, value chart, bar chart, etc.) visualise the recorded measured values and help users to evaluate them for the respective purpose.
The software’s high flexibility allows users to adapt the recording and visualisation of data to specific tasks. Users can adjust the software according to their requirements – from a configuration that is easy to use to any individually defined measurement process control.
Online alarm monitoring creates transparency
Recording a mass of data in a short time, as is the case with process parameters from assembly systems, injection moulding machines or furnaces, requires real-time visualisation and alarm monitoring.
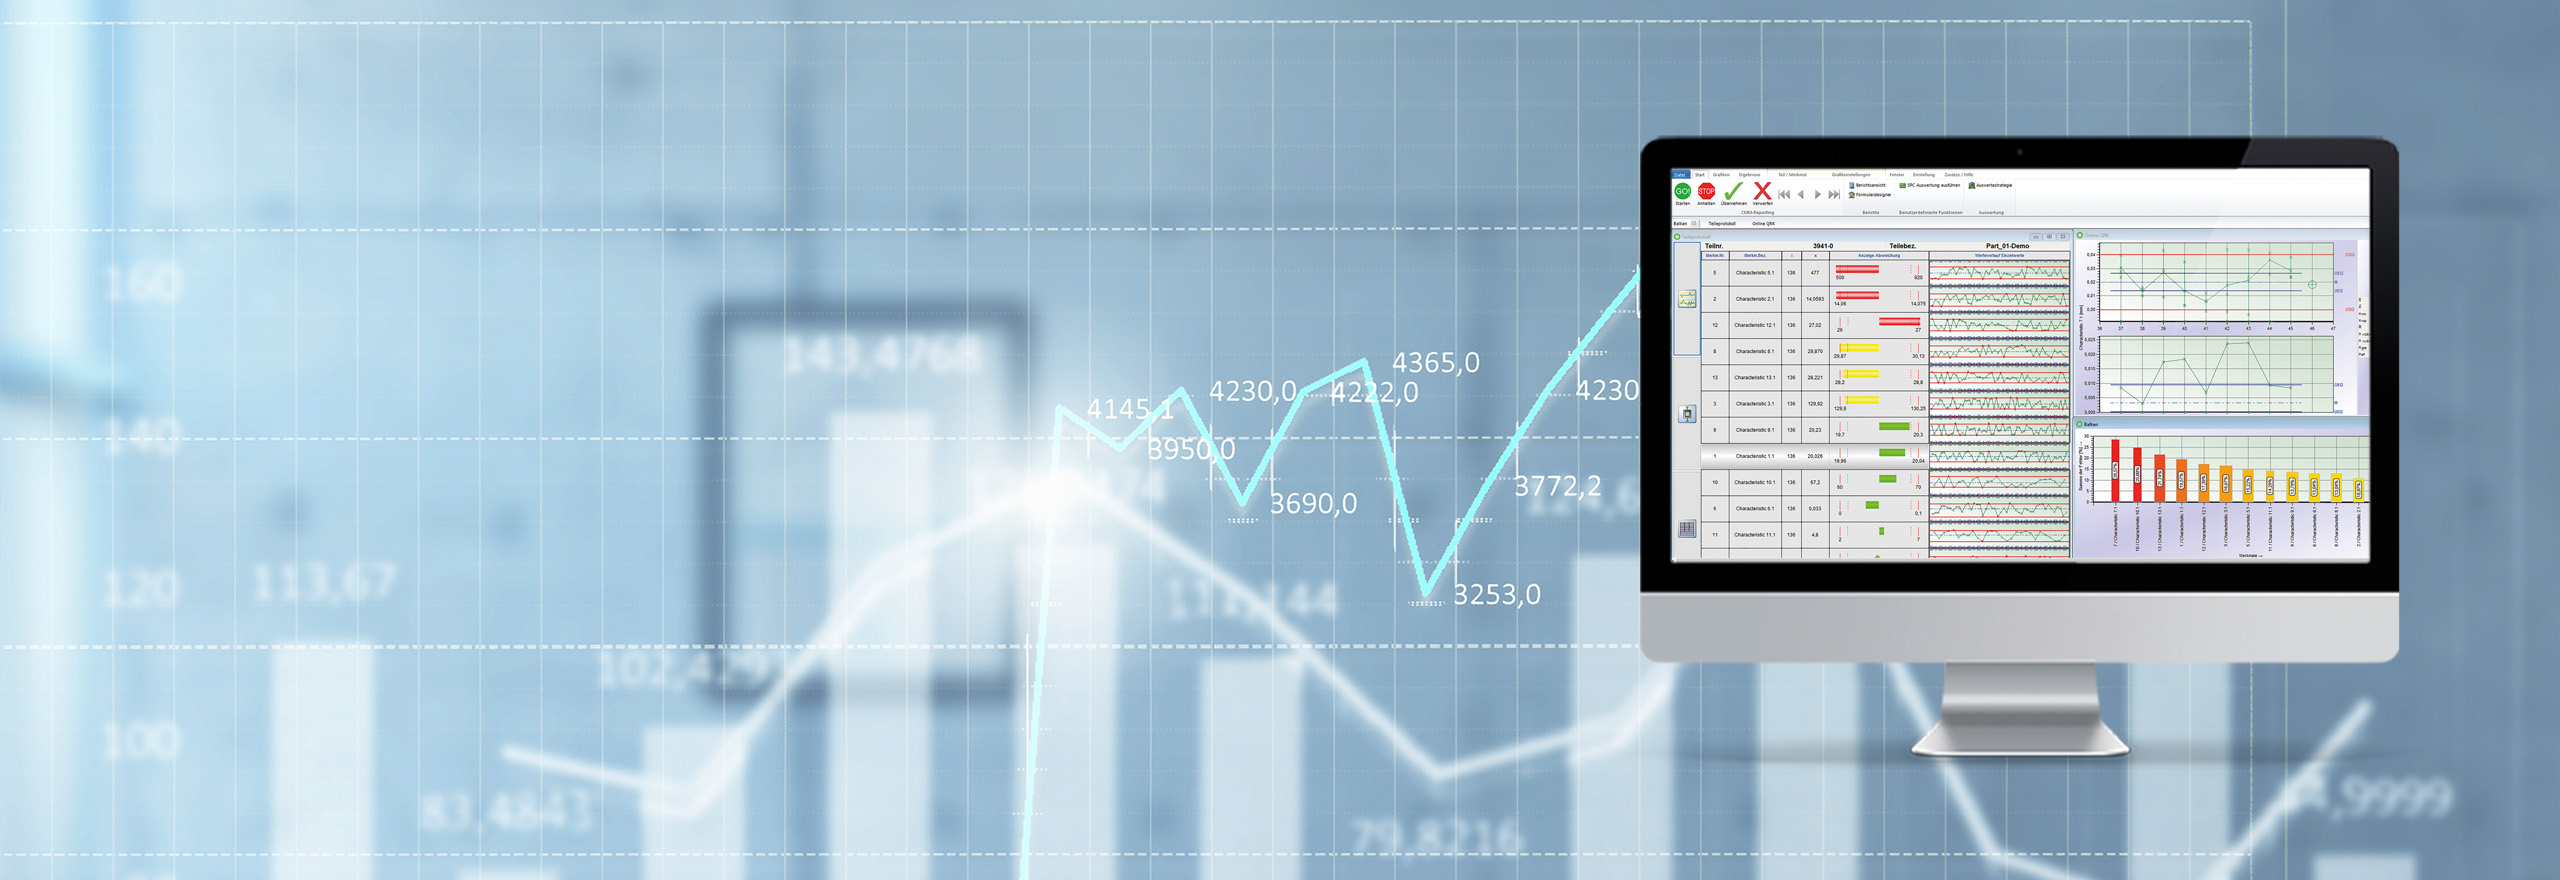
Whether you need to show individuals, trend charts of measured values or a compact status indication of each production facility, O-QIS® offers the graphics and tables you need. The software transfers the data collected by the measurement system in the Q-DAS ASCII transfer format.
Real-time visualisation for smart decisions
The visualisation of measurements including many characteristics and long measurement cycles, e.g. measurements from coordinate measuring machines or complex measuring devices, focuses on characteristics causing problems; the software highlights them. This approach makes it easy to identify the weak points of a process.
A well-structured graphical user interface with simple buttons wins high acceptance among users.
Alert function raises confidence
In order to minimise the risk of overlooking deviations from target specifications, O-QIS immediately checks whether measured values meet individual alarm conditions. There are different ways to inform selected users of an alarm that has occurred. The software shows the characteristics causing the alarm and is also able to generate and send reports automatically (printout, PDF, E-Mail or SMS).Extensions:
-
Form Designer
Individual design of reports
Q-DAS Form Designer makes it easy to create and modify available report templates. You may apply these templates in any Q-DAS software product. The interaction with M-QIS helps you adapt reports to the specific requirements of your intended recipients. Select from a toolbox of texts, statistics, parts data, characteristics data and additional data, as well as graphics (qs-STAT graphics and image files in the BMP, JPG, EMF and WMF format) and add links and logical operation formulas. Use drag-and-drop functionalities to position these elements in a report.
-
Q-DM Datamanagement
Automated data transfer of files provided from third-party systems to the Q-DAS database
The Q-DAS database forms the basis for statistical evaluations in qs-STAT. Only the database makes it easy to compare different information (machines, orders, etc.) and evaluate them automatically in M-QIS Engine.
Transfer of dataQ-DM is typically installed on a server in your network, sometimes even as a service. It monitors directories cyclically storing Q-DAS files. As soon as you store a file in a directory you Q-DM monitors, the systems saves its contents to a Q-DAS database. This process is based on defined rules you adjusted in Q-DM; these rules ensure a clear allocation of measurement information in the database.
You may adjust a wide range of settings, e.g. how to respond to alarms occuring while loading files in the database and store specific information to be considered in subsequent evaluations. The tool is able to generate protocols when a problem occurs while transferring data, e.g. due to a missing network connection or erroneous files and sends them to system administrators by email. The major task of Q-DM Datamanagement is to guarantee a smooth data flow.
ConverterIn case your data are not available in the Q-DAS data format, you may apply a converter in Q-DM. It converts the foreign format into Q-DAS files and loads them in the database.
-
SAP QM-STI interface
Analyse the measured value information available in SAP
The "Statistical Data Interface (QM-STI)“ of SAP R/3's QM module helps you evaluate data that have already been saved in the SAP system in Q-DAS statistical software products. SAP transfers the data to be evaluated to Q-DAS via QM-STI interface. Now you use qs-STAT to start Q-DAS analyses.