Q-DAS procella | Process Control
procella is the tool for statistical process control of quantitative and qualitative measured values
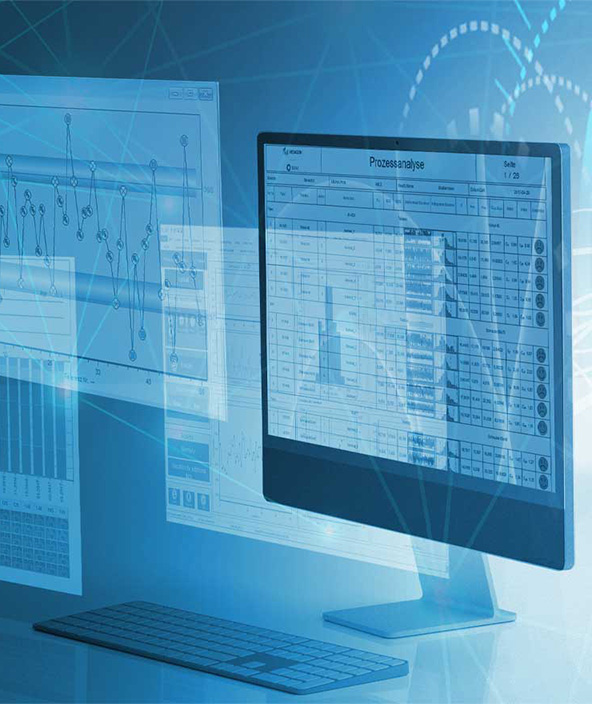
Process Control
With Q-DAS procella, data are saved in files or centrally in databases. It can also display quantitative and qualitative measured values.
Ready to learn more?
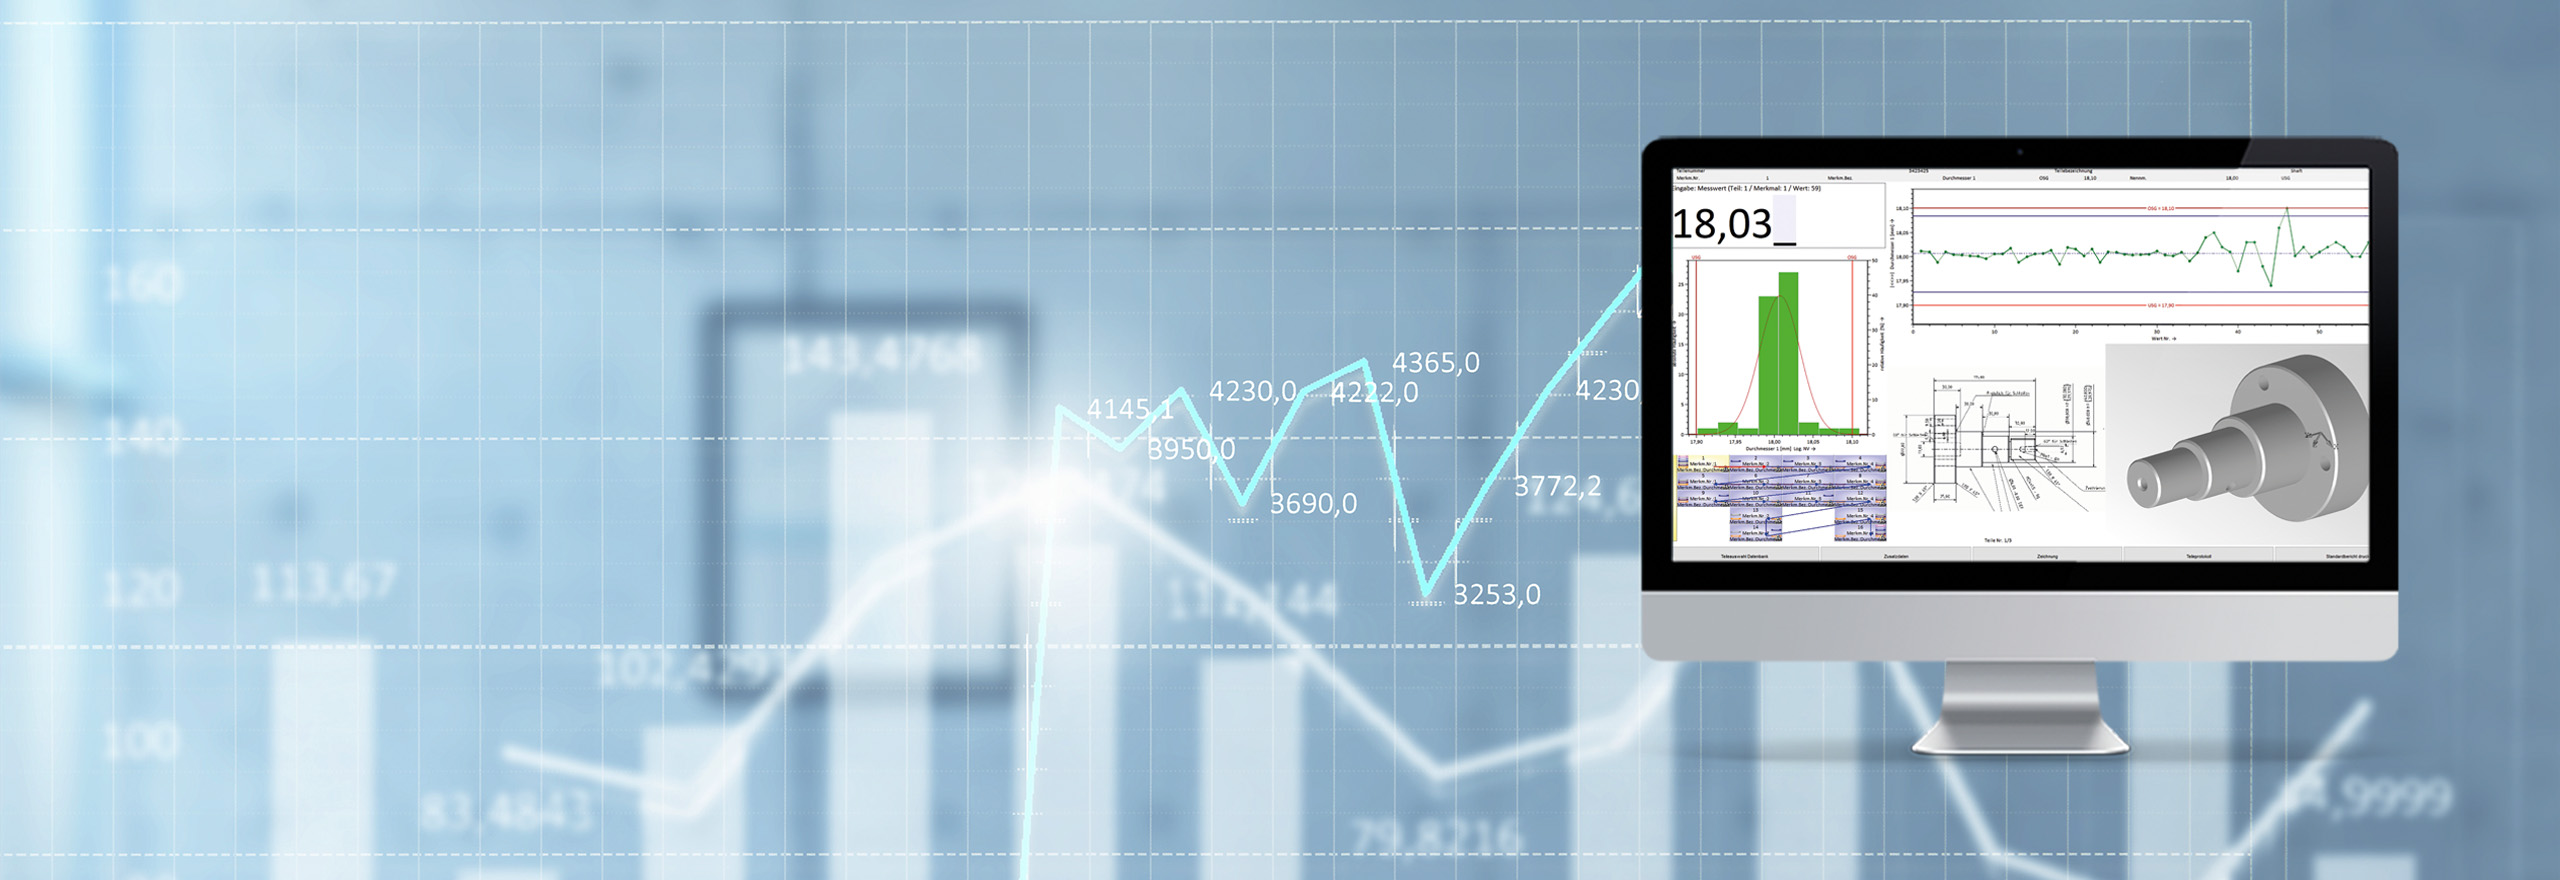
Tailor-made visualisation
Real-time visualisation of collected values combined with the display of historical data allows users to identify trends early. The operator has the power to take corrective action to improve the manufacturing process in time.Product capabilities
Alarms / process control
Individually configured alarm conditions (violation of tolerance or control limits, trends, etc.) help to control data statistically already during data recording. When a violation of alarm conditions occurs, the operator will be prompted immediately to acknowledge the alarm. The operator can even document measures, events and causes – a secure means for understanding the cause of deviations in subsequent analyses.
Moreover, users may enter descriptive additional information (cavity, machine, batch, operator, etc.) and procella considers relevant information in specific evaluations and for reasons of traceability.
procella is not only suitable for manual input of data but provides interfaces to connect various gauges and multiplexers directly. The software offers an easy transfer of data triggered at the gauge or by foot switch. With all its functionalities, procella is dedicated to minimising the number of faulty insertions and simplifying the measurement procedure.
Users may transfer test plans generated in SAP to procella for data recording by connecting the Q-DAS software to SAP/R3 QM (via IDI interface). After completing the inspection, recorded data are transferred back to SAP. Due to its real-time visualisation, procella is the tool of choice for data recording. The interaction with SAP combines the high flexibility of procella with the advantages of a superordinate SAP system.
Extensions:
-
Form Designer
Individual design of reports
Q-DAS Form Designer makes it easy to create and modify available report templates. You may apply these templates in any Q-DAS software product. The interaction with M-QIS helps you adapt reports to the specific requirements of your intended recipients. Select from a toolbox of texts, statistics, parts data, characteristics data and additional data, as well as graphics (qs-STAT graphics and image files in the BMP, JPG, EMF and WMF format) and add links and logical operation formulas. Use drag-and-drop functionalities to position these elements in a report.
-
Serial interfaces
Connect portable measuring instruments and test boxes
You may use qs-STAT to transfer measurement data directly via serial interface (RS-232).
-
SAP QM-STI interface
Analyse the measured value information available in SAP
The "Statistical Data Interface (QM-STI)“ of SAP R/3's QM module helps you evaluate data that have already been saved in the SAP system in Q-DAS statistical software products. SAP transfers the data to be evaluated to Q-DAS via QM-STI interface. Now you use qs-STAT to start Q-DAS analyses.