Definition of bio-mechanical liver model to use it in a Finite Element Method
Università degli Studi del Molise, Corso di Laurea in Ingegneria Medica
Different works has been investigated in order to define the liver tissue behavior subjected to tensile test. The results showed different experimental data and large experimental scatter due to a hard experimental set-up: the liver is a material whose properties depends on many factors, concerning not only the subject from which the liver is taken (animal species, age, hydration, previous injuries and illnesses) but also the specimen preparation in the laboratory (fresh or frozen, degree of degradation, the presence of different structures inside like arteries and vein).
It’s almost impossible find two studies which use the same experimental set-up.
In every simulation the data are elaborated by Patran, and the computations are solved by Nastran.
In order to start a first modeling procedure in the following simulations has been used data from Andrew R. Kemper et al. article:
- The geometry of the specimen is a dog bone;
- The constraint is a fix displacement of a specimen head;
- The load is a displacement of -2,7 mm along the y-axis of the specimen (it’s the final distance between two optical markers placed on the specimen body);
- The mechanical properties are obtained from stress-strain graphic, whose average curve is expressed in terms of Green Lagrancian Strain – 2nd Stress Piola Kirchhooff.
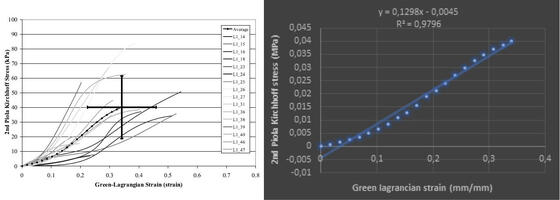
The first step is trying to model the behavior of liver parenchyma like it was a linear elastic material: the Young Modulus is approximated to 0,1298 N/mm2 and the Poisson’s coefficient is obtained from literature equal to 0,5.
The result of the simulation showed that the stress maximum concentration is located on the vertex of the specimen body, instead of the central section of the specimen. The value of maximum stress is slightly lower than the experimental value.
The errors are attenuated by the fact that the hypothesis of linear elastic material was not true. This kind of material is a visco-elastic material and the tensile curve is strongly depending from the strain rate.
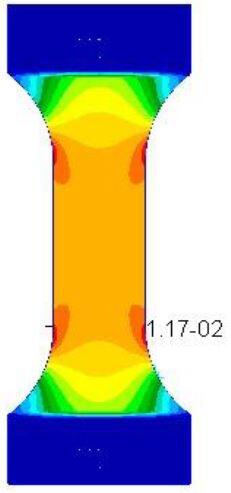
Later the liver tissue is modeling trying to create a non-linear model. Using the available curve three models have been created (Neo-Hookean, Mooney-Rivlin 2 and 3), but no one of those show convergences.
After those inconclusive simulations, the hypothesized causes for non-convergence models are:
- The geometry of the specimen, in particular the concentration point of maximum stress;
- The lack of data to define the material.
To prevent this problem, the geometry of the specimen is modified, trying to give continuity to specimen body, but being careful to limit not too much the specimen section.
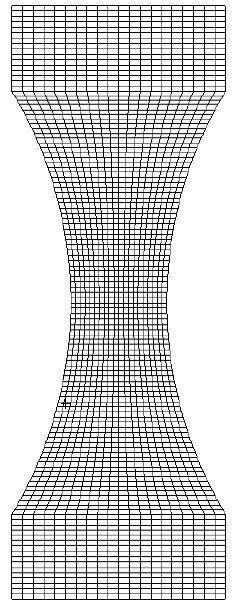
Considering that to represent a material whit hyperelastic behavior, data from up to five standard experimental tests are needed (Traction, biaxial, simple shear, pure shear and volumetric), the research of new articles, to improve the definition of material, is focused on those that study the liver behavior through an uniaxial tension test and at least another test.
After the analysis of several articles, the Z. Gao et al. article has been chosen where three tests are performed on liver tissue: tension, pure shear and compression. In our case only traction and a shear tests are available. The compressive test data are not useful.
In the article the curves are written in Stretch Ratio-Nominal Stress (kPa) graphics, and the data experimentally obtained are elaborated to create two Odgen models (logarithmic and exponential) to approximate the average behavior of experimental curves.
Before creating a non-linear model using the tension curves and pure shear curves, it’s necessary to convert the stretch in strain, because the input curve in Patran software must be stress-strain.
After taking the information from this article, the data for the modeling are:
- The modified geometry of dog bone specimen;
- The same constraint;
- The load is a displacement of -19,5 mm along the y-axis of the specimen, because in this article is showed the final specimen deformation;
The mechanical properties are obtained from stress-strain tension and pure shear graphic.
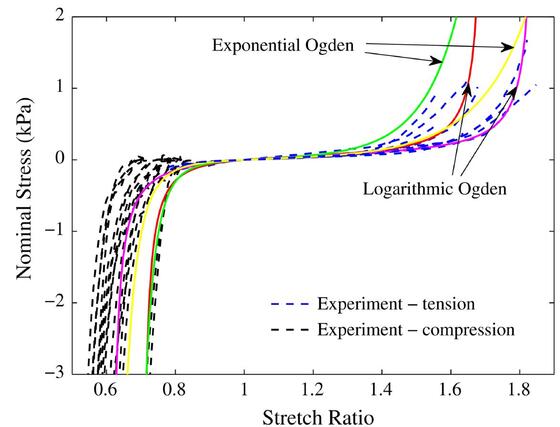
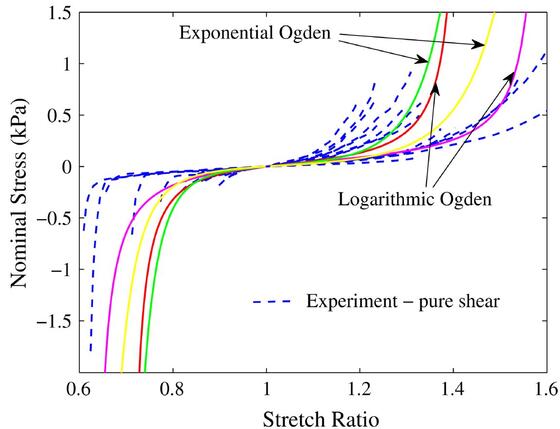
Eight Odgen (3) models are created using all the Logarithmic Odgen curves and Exponential Odgen curves. Every model, regardless of the goodness of the result, have convergence and show the maximum concentration stress in the central section of specimen.
The best Logarithmic Odgen model is created using the red curves, while the best Exponential Odgen model is created using the green curves.
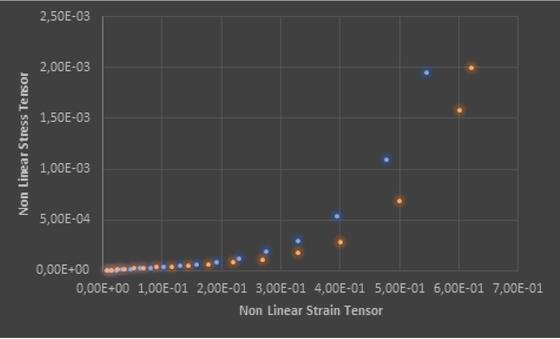
The graphics show the relation between Non Linear Stress Tensor e Non Linear Strain Tensor.
In the Logarithmic Odgen model the curve grows to a maximum value of 0,839 kPa, while in Exponential Odgen model the curve grows to a maximum value of 1,95 kPa.
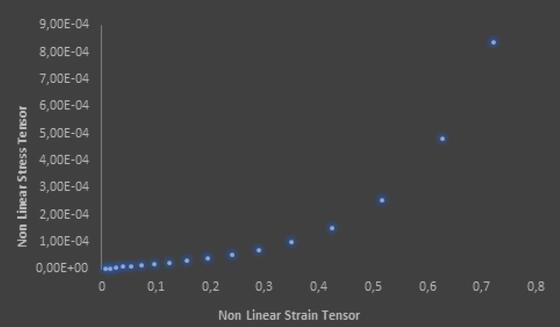
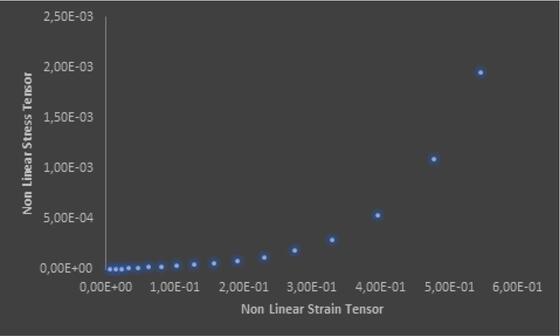
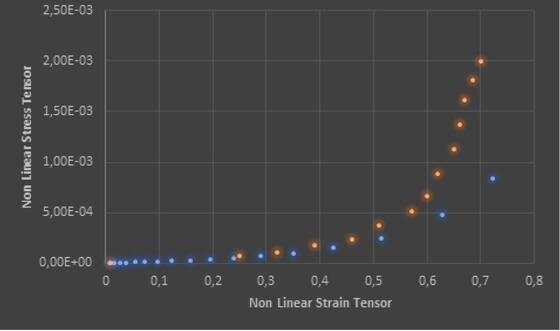
To verify the goodness of the results, the curves obtained from modeling are compared with the tension curve with which they are created, acceptable hypothesis because the specimen is pulled by uniaxial tension.
The study shows that using a single curve isn’t possible to create a non-linear model which have convergence. Instead using two curves, in this case tension and pure shear, the model has convergence, and in the batter case (Exponential Odgen model) has result similar to the experimental curve.
There is big limit of the model: Patran software can’t understand how much the specimen section change. That information can be given through a biaxial tension test.
Another limit of the model is the fact that it can’t consider the dependence on the load application speed. In viscoelastic material it’s a really strong dependence, but there aren’t found articles which do studies about these.
In conclusion, the Exponential Odgen model represents a good approximation of liver tissue behavior. That model can be improved and used to modeling the liver organ behavior.
Tesista: Martina Immacolata Stara
Relatore: Prof. Domenico Gentile