Piercing Phase Simulation of Flow Drill Screwdriving® (FDS®) for Sheet Metal Joining
Politecnico di Torino, Oakland University, Stellantis
In this Thesis research, the piercing phase of Flow Drill Screwdriving® (FDS®) for joining sheet metal is investigated. By developing a valid CAD model and simulating the process within the software MSC® Simufact® Forming® 2020, the aim is limiting time and costs implied by experimental feasibility verification during the Process Design, together with delivering a valid instrument for initial study of FDS® applicability.
Starting from a deepened Literature survey, in which the author researches the Screw’ main characteristics, special consideration is attributed to the process parameters, mainly axial force applied, torque and rotational speed. Consequently, the main physics behind these screws is reported, including a state of the art based on available documentation on precedent research and experiments, as well as the experimental set-up adopted for joint mechanical characterization and data on the workpiece material, AW6082-T6. Next, the 2D geometrical Axisymmetric model is defined in the Friction Welding module for the DP600 pre-drilled upper sheet and AW6082-T6 lower sheet piercing phase (Figure 1).

Attention is devoted to the correct definition of the roles of the Screw and the lower sheet, the contact conditions in the Contact Table section (a.i., by imposing “Glued” condition at Lowersheet-Lowersheet to avoid self-intersection consequent to Screw’ penetration) and the die movement and rotation in relation to time.
Due to the drilling procedure being centered on frictional heat exploitation, a careful description of the heat generation and flow is necessarily included into the FE model, for which the tribological model is developed from Skovron’ work (https://tigerprints.clemson.edu/all_dissertations/2185): a Mixed Coulomb-Shear contact condition is defined, with temperature-dependent Coulomb m friction coefficient and constant Interface shear factor m. These allow for the Scaling Factors (SF) choice to consider the temperature effect on the AW6082-T6 properties, where True Stress - True Strain curves (Figure 2) are developed from Johnson Cook Model with the five necessary material coefficients experimentally evaluated from data acquired in CRF® Laboratories in Melfi (PZ).

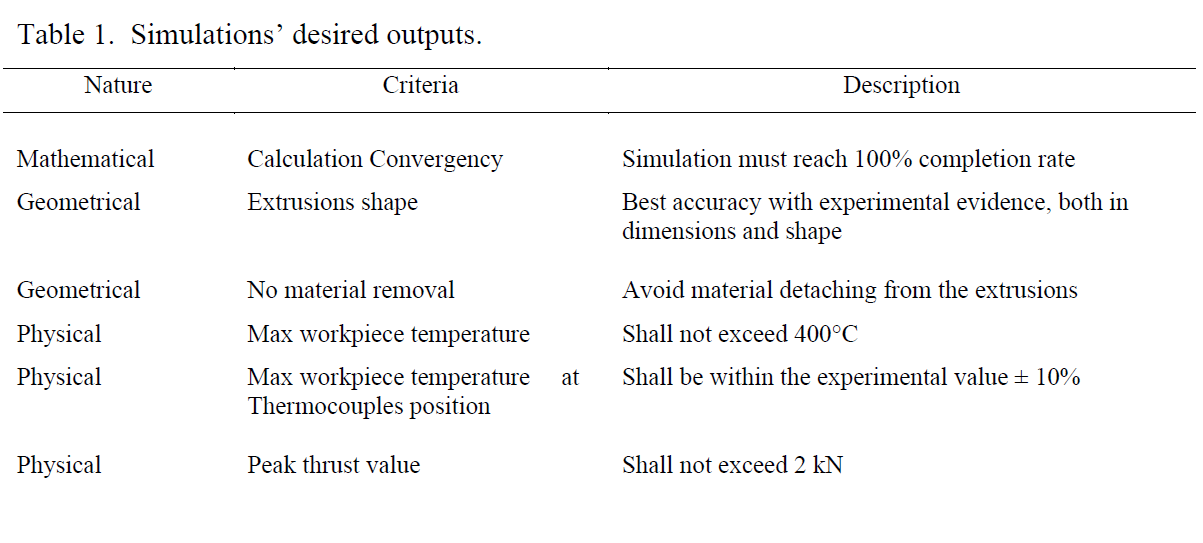
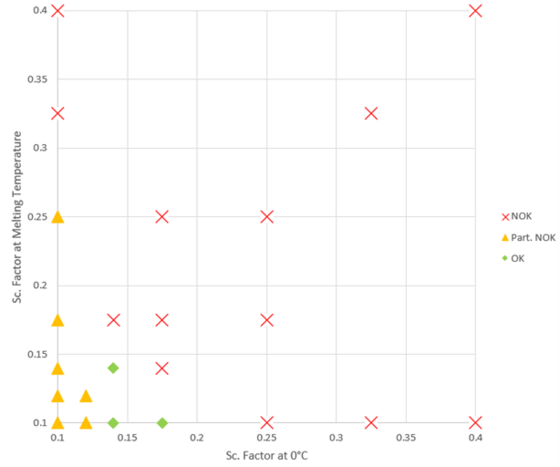
The Scaling Factors, both at 0°C and at AW6082-T6 Melting Point, were optimized by means of a heatmap study (Figure 3): starting from the acceptability criteria of Table 1, the condition “OK” is attributed to SF combinations for which all the criteria are respected, “Part. NOK” to when only measured Thrust force is higher than 2 kN (an issue commonly met) and “NOK” to all the others.
Subsequently a ¼ Factorial analysis is developed in Minitab® software to optimize the most relevant factors both for the simulation and for the joint manufacturing process. The effects of five factors (namely, Scaling Factor at 0°C, Scaling Factor at AW6082-T6 Melting Point, Coulomb m, Interface shear factor m and screw rotational speed) were evaluated on three outputs:
- “Percentage of success” Perc, whose possible values are 1 for successful run, 0.9 when only designed thrust maximum (in this study, equal to 2kN) is exceeded, 0.75 for all the other cases in which calculations convergency is still verified and 0.5 otherwise.
- Upper extrusion length L1 of the lower sheet (Figure 4).
- Lower extrusion length L2 of the lower sheet (Figure 4).
The only statistically relevant correlation which resulted is the inverse dependency between Interface shear factor and upper extrusion length.

In particular for what concerns the simulation factors, such as Coulomb m friction coefficient, Interface shear factor m and screw rotational speed (rpm), variations on workpiece material, thickness and width, as well as on lower sheet-screw contact condition and FDS® rotational speed, simulations are performed to observe the implied changes and, when possible, compare them with experimental evidence.
Generally, the software demonstrated valid for the required task, and the introduction of 2D Axisymmetry managed to lower the computational time to around 20 minutes per simulation (for 4 total threads on an Intel® Core® i5-6300U); excluding the differences related to the setting difficulties, especially at correctly stopping the assembling machine, the simulated piercing well reproduces the experimental evidence (Figure 5). Suggested continuation work regards simulating the Thread Forming phase by expanding the 2D results into a partial 3D, so that to finally obtain a completed FDS® simulated joint available for study and testing.

Author: Romano Alovisetti
Academic Advisor: Giovanni Belingardi, Sayed Nassar
Tutor: Raffaele Pepe, CRF
Academic Year 2020/2021