TE Connectivity erreicht ultimatives Ziel der End-to-End-Qualitätsprüfung dank CT-Analyse
Alexander Stokowski, TE Connectivity

Engineering Reality 2024 Ausgabe 1
Accelerate Smart Manufacturing
Die Software von Volume Graphics unterstützt Fertigungsunternehmen während des gesamten Design-, Simulations- und Herstellungsprozesses.
Die Entwicklung hin zur Volldigitalisierung überzeugt vor allem Fertigungsunternehmen, die einen höhere Automatisierung, Konnektivität und Zuverlässigkeit bei ihren Produkten und Maschinen anstreben. Umfragen u. a. des Manufacturing Leadership Council belegen ein hohes Investitionsaufkommen sowie gute Resultate aus Manufacturing 4.0 und den damit verbundenen digitalen Design- und Fertigungsinitiativen. Ein robustes digitales Framework sorgt für mehr Geschwindigkeit und Flexibilität bei der Erstellung und Verwaltung von Produktdaten.

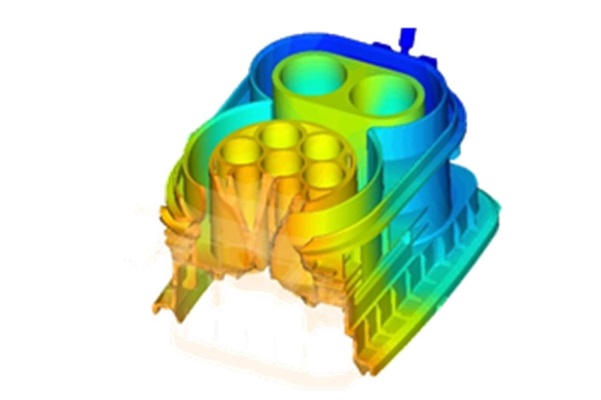
Abbildung 1. Die Simulation dient der frühzeitigen Qualitätskontrolle durch Prognosen zum Materialverhalten sowie Tests der Designparameter. Ein abschließender CT-Produktionsscan dieses Fahrzeug-Lade-Inlets informiert die Simulation auch über neue Variationen und fertigungsbedingte Formabweichungen. Abbildung mit freundlicher Genehmigung von TE-Connectivity.
Die Vorteile vernetzter digitaler Plattformen für traditionelle CAD/CAE/CAM-Disziplinen sprechen für sich. Dennoch gewinnt die Computertomographie (CT)-Analyse zur Qualitätsprüfung gerade im Hinblick auf die zunehmende Digitalisierung an Bedeutung. Die CT-Analysesoftware erweitert den Funktionsradius zentraler Tools von Design, Simulation und Fertigung, die normalerweise in einem anderen Umfeld eingesetzt werden, signifikant.
Feedback von CT-Analyse an Design und Produktion
Der Ansatz der modellbasierte Definition (MBD) führt das Engineering zunehmend über Zeichnungen und hybride Methoden hinaus. Die Abkehr von manueller Datenauslesung hin zu MBD schafft umfassendere und breitere Informations-Threads innerhalb der gesamten Produktentwicklung, von PMI-Dateien (Product Manufacturing Information) bis hin zu Maschinen- und sonstigen Programmen.
Aber nicht nur Anmerkungen zu Geometrie und Fertigungsanweisungen werden digital übermittelt. Unternehmen schaffen Informations-Loops für Design, Simulation und virtuelle Tests, welche die Genauigkeit und Konformität mit den Spezifikationen verbessern sowie die Zeit bis zur Produktion verkürzen.
Diese neuen Entwicklungszyklen verstärken den langjährigen Trend, Entscheidungen innerhalb des Produktionsprozesses immer früher zu treffen und die Validierung von Produkten und Herstellungsverfahren weniger spät anzusetzen.
Neue Maßstäbe bei der Qualitätsprüfung
Es ist sinnvoll, dass ein Unternehmen, das sich u. a. mit Konnektivität und Sensorik für Elektrofahrzeuge, Flugzeuge, digital-intelligente Fertigung, Wind- und Solarenergie, Cobots, IoT und High-Speed-Konnektivität befasst, in MBD und moderne Prüfverfahren investiert. TE Connectivity hat sich zum Ziel gesetzt, den technologischen Wandel im Unternehmen durch zuverlässige und langlebige Elektronikprodukte voranzutreiben.
Dieser „technisierte“ Weg bringt die Vorteile der ISO-Standards für geometrische Produktspezifikation (GPS) und der virtuellen Messtechnik mit den limitierten klassischen Design-Workflows in Einklang. Bisherige Workflows nutzen Zeichnungen, 2D- und 3D-Digitalsysteme. Sie sind zwar weniger komplex als MBD, können aber bei Modellumwandlungen oft Informationen verlieren und erfordern bei der Erstellung von Qualitätsmessprogrammen eine aufwendige manuelle Programmierung.
„GPS ist die einzige Möglichkeit, echte modellbasierte Systeme und genaue mathematische Definitionen zu erstellen“, sagt Alexander Stokowski, Development Director bei TE Connectivity. Stokowski, zertifizierter Six Sigma Black Belt und Dozent für Messtechnik und GPS an der Dualen Hochschule Baden-Württemberg (DHBW), engagiert sich seit einem Jahrzehnt für die digitale Transformation.
„GPS ist wichtig, um die Mittelachse eines Bauteils zu bestimmen, eine 90-Grad-Messrichtung zu erhalten und Punkte zu erkennen. Wenn man dabei nicht mathematisch genau ist, kann man kein realistisches Messsystem erstellen, geschweige denn automatisieren“, sagt Stokowski.
Für Stokowski und TE Connectivity begann der Weg zur MBD- und GPS-Konformität und -Integration mit der CT-Datenanalyse für Automobilprodukte Anfang 2012. Damals starteten die ersten Pilotprojekte. „Ende 2013, zwei Jahre nachdem wir angefangen hatten“, sagt Stokowski, „haben wir uns dafür entschieden, jede neue Produktentwicklung in die CT-Messumgebung zu bringen – um eine 100-prozentige Quote zu erreichen.“


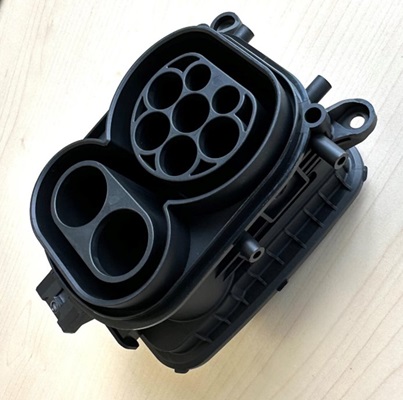
Abbildung 2A. (links) Gegossenes physisches Muster eines Kombigehäuses für ein Hochleistungs-Lade-Inlet, das zuvor in der Software Moldflow getestet wurde. Abbildung 2B. (rechts) CAD-Modell des Inlets mit PMI-Qualitätsanmerkungen zu den Toleranzen. Es ist keine Datenkonvertierung aus Creo erforderlich. Detaillierte CAD-PMI wird automatisch direkt in VGMETROLOGY importiert. Abbildung mit freundlicher Genehmigung von TE Connectivity.
Diese Pionier-Entscheidung wurde zu Beginn der Einführung neuer ISO-Standards für die Branche getroffen und führte zu einer engen und intensiven Zusammenarbeit zwischen PTC (Creo), TE Connectivity und Volume Graphics (VG), um eine Integration der neuen ISO-konformen GPS-Funktionen zu schaffen.
Patrick Bertram, Principal Engineer Moulding Simulation bei TE Connectivity, war überzeugt, dass die Simulation des Formaufbaus als Bestandteil des Qualitätsprozess der Schlüssel für Innovation ist. Bertram holte die Lieferanten Volume Graphics und SIMCON mit ins Boot, um eine automatisierte Schnittstelle zwischen Mess- und der Simulationssoftware zu schaffen.
Durch die vollständige, herstellerübergreifende Integration konnten modellbasierte Anmerkungen und PMI besser genutzt werden – mit Loops von virtuellen Tests und realen Messergebnissen zurück zu Design und zur FEA-Simulation und weiter zu Prototyping, Erstmusterprüfung (First Article Inspection, FAI) und Produktion.

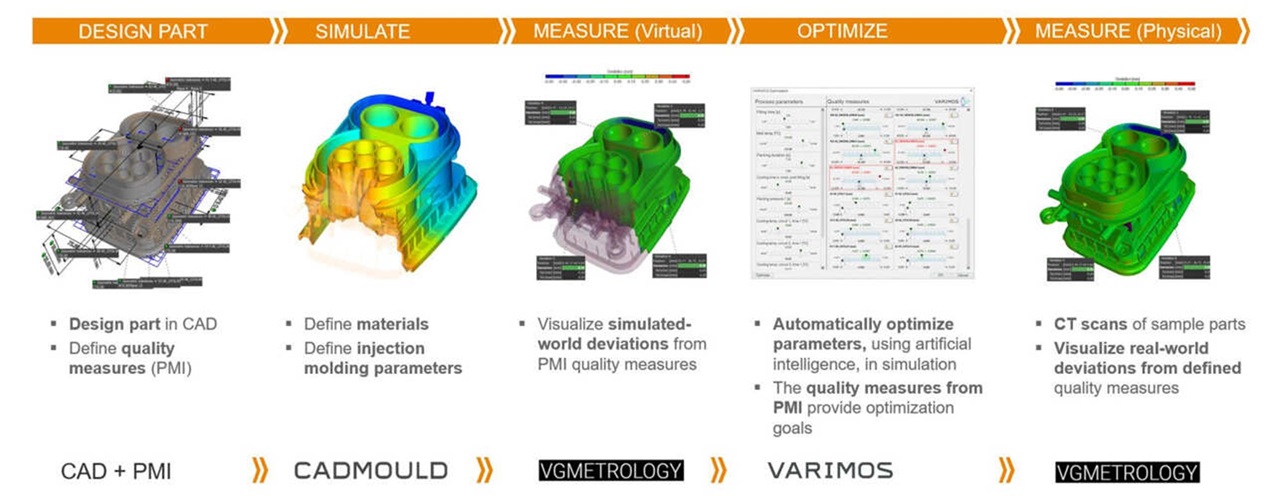
Abbildung 3: Virtueller und realer Qualitätsworkflow — (links-rechts) Design eines Teils und Definition von Qualitätsmessungen; Erstellen digitaler Berichte und Simulationsfeedback für das Design, falls erforderlich; Visualisierenund Bewerten eines Teils aus PMI; Einsatz von KI in Simulations- und Scanprogrammen zur Optimierung von Parametern; CT-Scan von Musterteilen für physische Abweichungen. Nach dem Design: Vorbereitung der Inline-Inspektion (Makros, Scans, Analyse, Auswertung). Nach der Produktion: Bauteilanalyse vor Ort und Feedback an Design – mit dem Ergebnis kontinuierlicher Verbesserung. Abbildung mit freundlicher Genehmigung von TE Connectivity.
„Wir haben damit bereits im Vorfeld Standards gesetzt“, sagt Stokowski. „Warum 3-5 Jahre warten, wenn in den ISO-Entwürfen die Anweisungen, wie z. B. die Darstellung von 3D-Anmerkungen, klar sind?
„STEP 214 und 242 haben für unsere Integration nicht funktioniert“, sagt Stokowski. „Wir haben API (Application Programming Interface) im Creo-Toolkit und ISO-GPS verwendet, um die direkte Schnittstelle zur VGMETROLOGLY- und VGSTUDIOMAX-Software zu erhalten. Ergänzt um kundenspezifische Spezialfunktionen, mit denen wir von FAI abgeleitete Werte wiederverwenden können. Und das ist es: Geometrische Form- und Lageetoleranzen (GD&T) von Creo und VGMETROLOGY sowie die Integration von VARIMOS von SIMCON. Es ist keine weitere Software erforderlich, um Design und Simulation mit Qualitätsmessung zu verknüpfen.“
Vorrangiges Ziel des digitalen Messprogramms von TE Connectivity bestand darin, sicherzustellen, dass der Entwurf mit den gefertigten Bauteilen übereinstimmt. D.h. in der Regel mit Formen mit normaler Mittentoleranz und typischen Push-Out-Markierungen und kleinen Fehlern zu arbeiten. Die Simulation des Formaufbaus und die virtuelle Messtechnik können sowohl funktionale als auch kosmetische Defekte bei der Herstellung von Formen und Kunststoffteilen identifizieren und beheben. FAI führt zu einem Feedback-Loop, in der 3D-Modell und Simulation, Form und gefertigtes Teil mit wenigen bis gar keinen Abweichungen abgestimmt und angepasst werden. Die Software von Volume Graphics erstellt die Qualitätsvorlagen für die automatisierte Qualitätsprüfung.
„Noch vor zehn oder fünfzehn Jahren haben Designer sich nicht viel Gedanken um die Details des Formaufbaus gemacht“, sagt Stokowski. „Das übernimmt nun die Werkzeugsoftware und der Automatisierungs-Loop, den wir festlegen. Alle Daten stehen unseren interdisziplinären Teams vollständig zur Verfügung und können schnell genutzt werden.“
Rentabilität der Qualität (ROI)
Der hohe Stellenwert des Faktors Qualität wird oft vernachlässigt. Qualität baut Marken auf, zieht Kunden an und reduziert die Backend-Kosten für Garantieansprüche, Servicearbeiten sowie Prozess- und Designverfahren, um auftretenden Problemen auf den Grund zu gehen.
Auf der anderen Seite akzeptieren Finanzmanager oft nur unbedingt erforderliche betriebliche Investitionen und geben sich mit einem profitablen Status Quo zufrieden. Ingenieure sind frustriert, wenn sie mit der Adaption neuer Systeme konfrontiert sind, die noch komplexer sind als deren Vorgängerversionen. Die Investition in Qualitätsmaßnahmen sowie deren Umsetzung stellt für viele Unternehmen eine Herausforderung dar.
„Der wahre Mehrwert von Qualität für TE Connectivity liegt in der Zeit, die wir sparen“, sagt Stokowski. „Zeit und den hohen Stellenwert, den Kunden langlebigen, zuverlässigen, erstklassigen Produkte beimessen.
„Welchen Wert haben 4-6 Wochen weniger Zeitaufwand für Entwicklung im Engineering, die dann möglicherweise für die Auslieferung eingeplant werden kann?“, fragt Stokowski. „Wie wird das entsprechend mit den Kosten für Maschinen und Software verrechnet? Genaue Antworten darauf gibt es nicht“, sagt er. „Aber wir haben ein Centre of Excellence (CoE), das eng mit unseren Kunden zusammenarbeitet, unser Personal schult und eine Qualitätsinfrastruktur schafft, die zur Innovation beiträgt. Diese Aussage in Bezug auf Unternehmenswerte steht schon für sich.“

Abbildung 4: Motorsteuergerät (ECU) für die Automobilindustrie mit 200 elektrischen Steckerstiften. Dies war das erste Test-Bauteil von TE-Connectivity zur Automatisierung der Qualitätsprüfung. Foto mit freundlicher Genehmigung von TE Connectivity.
Deutliche Zeitersparnis
„Wir liegen mit Design, Simulation, Scanning und Erstellung eines digitalen Messberichts im Zeitrahmen von zehn Tagen“, sagt Stokowski. „Bereits im Vorfeld passiert jetzt so viel. Wir möchten so viel wie mögich bereits erledigt haben, bevor wir ein physisches Teil in Händen halten.“

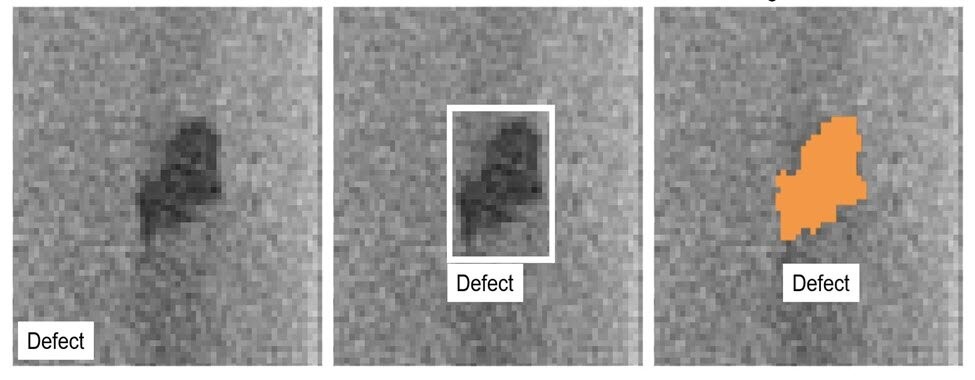
Abbildung 5: Künstliche Intelligenz und maschinelles Lernen werden zur Kennzeichnung, Klassifizierung von Qualitätsdaten, Lokalisierung von Problemen und Deformationssegmentierung zur Identifizierung und Durchführung entsprechender Maßnahmen bei der automatisierten CT-Analyse eingesetzt. Abbildung mit freundlicher Genehmigung von Volume Graphics
Volume Graphics hat TE Connectivity beim Frontloading und Looping von Daten mit ihren ‚Adaptiven Messvorlagen‘ unterstützt. Diese Vorlagen können Deformationen mithilfe von KI und maschinellem Lernen klassifizieren, lokalisieren und segmentieren. Sie automatisieren auch einen Großteil der Scananalyse und erfassen dann Informationen für Messberichte. Das Ziel von TE Connectivity ist es, die Analysezeit von zehn auf fünf Tage zu reduzieren.
Eines der ersten Projekte von Stokowski, der „klassische Designzyklus“, fand kurz vor der digitalen CT-Analyseinitiative 2014 statt, bei der die Software von Volume Graphics zum Einsatz kam. Es umfasste den Formaufbau sowie die Entwicklung einer Motorsteuereinheit für die Automobilbranche. Dieses Steuergerät verfügte über mehr als 200 elektrische Steckerstifte.
Stokowski sagt: „Es dauerte fast ein Jahr und mehr als zehn Iterationsschleifen, um das Teil in die Zeichnungsanforderungen zu übertragen. Es war eine anstrengender, schier endloser Prozess. Und nur dreieinhalb Jahre später mussten die ersten Tools ausgetauscht werden. Sie können sich die Reaktion des Teams vorstellen! „Oh mein Gott ... wir brauchen ein weiteres Jahr, um die Konditionierungs- und Korrekturschleifen durchzuführen, dachten sie sichtlich resigniert“, lacht Stokowski.
„Zu diesem Zeitpunkt hatten wir bereits einen digitalen Messprozess implementiert und das Design für den Formenaufbau innerhalb eines Loops erstellt“, sagte er.

Abbildung 6. (links-rechts) Patrick Bertram, Principal Engineer Molding Simulation; Alexander Stokowski, Director Engineering Transformation, leitet das erste ECU-Projekt, das CT-gemessen und digitalisiert werden soll; und Tabrez Ahmed Ajaz, Manager COE GD Metrology. Abbildung mit freundlicher Genehmigung von TE Connectivity.
Das Ziel: Reduzierung der Entwicklungszeiten um 75 %
Mittlerweile möchte TE Connectivity seinen Entwicklungsprozess für Formen und Bauteile auf 25 % der früher benötigten Zeit zu reduzieren. Einige manuelle Aufgaben werden sicher bleiben, sagt Stokowski – wie etwa die manuelle Feinabstimmung von GD&T oder Zeiten, in denen ein Problem diskutiert oder eine digitale Diskrepanz im „Thread“ behoben wird. Es gibt auch nicht die Ressourcen, um für jeden Formaufbau ein Design of Experiments (DoE) durchzuführen. Für kritische Formaufbauten werden wir jedoch mit DoE arbeiten, und alle neuen Formen werden die VGMETROLOGY-Software durchlaufen.
Auch die Lieferanten übernehmen diese neue Herangehensweise. Viele haben eigene virtuelle Messsysteme erworben. 20 bis 30 % der externen Werkzeughersteller nutzen das gesamte integrierte digitale System. Andere lassen außer Haus scannen und verwenden die Software intern. Alle Werkzeughersteller führen vor der Erstellung eines vollständigen Messberichts innerhalb des CoE eine Überprüfung der Materialkonformität und grundlegende Messungen durch.
Stokowski geht davon aus, dass der Qualitätsprozess von TE Connectivity irgendwann von allen Lieferanten übernommen wird, wenn auch noch nicht kurzfristig, da sowohl für GPS als auch für virtuelle Messtechnik noch Vorbehalte bestehen, insbesondere was die Kosten betrifft. Bis dahin werden sein Team und das CoE auf einen zukünftigen 'Push-Button'-Prozess hinarbeiten, auch wenn sie aus praktischen Gründen davon ausgehen, dass dieser auf „75 % unserer Arbeit verwendet würde“, sagt Stokowski.
Im Zuge der Qualitätsverbesserungsprozesse erreichte TE Connectivity folgende Meilensteine:
- Alle neuen Spritzgussteile werden in MBD umgesetzt
- 100 % der Spritzgussteile werden gescannt und es gibt keine taktilen Messungen mehr
- Bauteilspezifikationen werden in Creo nach ISO-GPS-Standards erstellt und in ein neutrales 3D-PDF umgewandelt, wo erforderlich
- Die Integration zwischen Creo- und VGMETROLOGY-Software erfolgt direkt
- 75 % aller Produktdaten werden über PMI transportiert
- Es fällt nur vereinzelt Nacharbeit im Falle von Schnittstelleninkompatibilitäten an
Für die abschließende Bauteilprüfung verfügt TE Connectivity in der EMEA-Region über sechs Inline-Scanner für Spritzgussteile. Die Scanner und die Volume Graphics Software konzentriert sich – nach dem Messbericht – auf die wichtigsten Abmessungen und Zielbereiche und nicht auf das gesamten Bauteil. Kosten und Zeit spielen hier eine Rolle. Aber auch das virtuelle Design sowie Analyse und Tests in einem so frühen Planungsstadium zusammen mit Kontrollen während der Erstmusterprüfung stellen sicher, dass die Complianceabforderungen erfüllt und in der Fertigung nochmals überprüft werden. Das Unternehmen unterhält 23 Scanner weltweit, eine globale Lizenz für Creo und vollständige Softwarepakete von Volume Graphics. Dazu betreibt es ein Kompetenzzentrum zur Integration und Verbreitung dieser digitalen Technologien.
Qualität ist das entscheidende Kriterium
Debatten im Unternehmen darüber, wie viel in Technologie investiert werden soll, gibt es immer wieder. Generell spielt aber der Qualitätsfaktor für Fertigungsunternehmen eine entscheidende Rolle, weil er alle Unternehmensbereiche beeinflusst und nach außen hin eine hohe Kundenbindung schafft.
„Dank unserer Qualitätsinstrumente und digitalen Systeme lernen wir bei TE Connectivity viel über unsere Produkte – insbesondere, was deren Verbesserungsmöglichkeiten betrifft oder um Abweichungen erkennen und prognostizieren zu können“, sagt Stokowski. „Wir sparen Zeit und fertigen ausgezeichnete Produkte, die andere Industriebereiche wie die E-Mobilität voranbringen“, sagt er. „Virtuelle Messtechnik und Digitalisierung bieten unendliche Möglichkeiten, wenn man sich dafür entscheidet, sie auch zu nutzen.“